- Date
- Views
- 2
- Time
- 10 分钟.
What Is MACD (Moving Average Convergence Divergence)?
Key Takeaways:
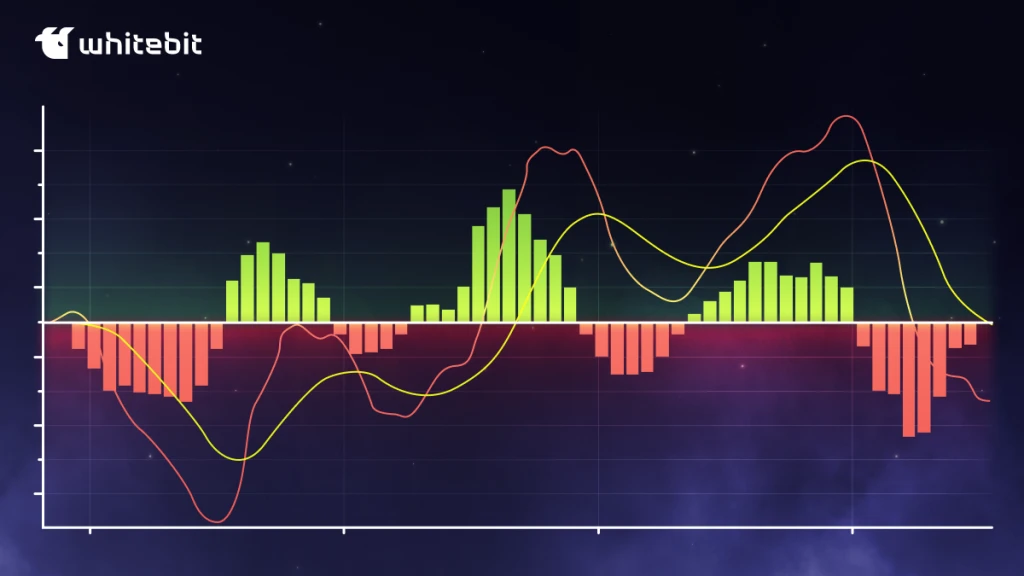
- MACD is a momentum indicator that measures the relationship between two exponential moving averages to identify trend direction and momentum.
- The indicator consists of three components: the MACD Line, Signal Line, and Histogram, each providing different types of trading signals.
- Traders commonly use the MACD to identify crossovers, divergences, momentum shifts, and zero-line crossovers.
- The default 12, 26, 9 settings work for most markets, but the moving average convergence divergence indicator can be customized to suit different trading styles and timeframes.
What Is MACD In Trading?
MACD (Moving Average Convergence Divergence) is a technical analysis indicator that measures trend direction and momentum by tracking the relationship between two exponential moving averages of an asset’s price.
How To Read MACD Histogram?
The MACD histogram is a visual representation of the difference between the MACD Line and the Signal Line, helping traders quickly assess the strength and direction of market momentum.
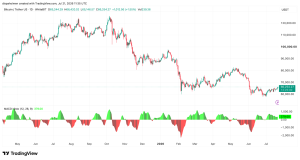
Bars above the zero line indicate bullish momentum, while bars below zero suggest bearish momentum. As the histogram bars grow taller, momentum is strengthening; as they shrink, momentum is weakening, often signaling that a trend reversal or slowdown may be approaching.
Calculating MACD
The MACD is calculated by subtracting the 26-period Exponential Moving Average (EMA) from the 12-period EMA of an asset’s price. A 9-period EMA of the MACD Line is then calculated to create the Signal Line, while the MACD Histogram represents the difference between the MACD Line and the Signal Line.
The formulas are:
- MACD Line = 12-period EMA − 26-period EMA
- Signal Line = 9-period EMA of the MACD Line
- MACD Histogram = MACD Line − Signal Line
How to Read MACD Signals?
MACD signals are typically interpreted through four key elements:
- MACD crossovers – occur when the MACD Line crosses above or below the Signal Line, indicating a potential bullish or bearish shift.
- MACD divergence – appears when the price and the MACD move in opposite directions, which may signal weakening momentum or a possible reversal.
- Signal Line interactions – help traders identify changes in short-term momentum and potential entry or exit points.
- Zero Line crossovers – occur when the MACD Line moves above or below zero, suggesting a change in the broader trend direction.
Trading Using MACD
The MACD in trading is commonly used to identify trend direction, measure momentum, and detect potential market reversals. Rather than generating standalone trading decisions, the indicator helps traders interpret price action by analyzing the relationship between its three components: the MACD Line, Signal Line, and Histogram.
The most common ways to use MACD in trading include:
- Identifying trend direction by determining whether the MACD remains above or below the zero line.
- Spotting momentum shifts through changes in the histogram, which indicate strengthening or weakening buying or selling pressure.
- Detecting entry and exit opportunities using bullish and bearish crossovers between the MACD Line and the Signal Line.
- Recognizing potential reversals by identifying bullish or bearish divergences between the MACD and price action.
- Confirming price trends alongside other technical indicators, such as RSI, moving averages, trading volume, or support and resistance levels, to filter out false signals.
MACD Settings
The MACD indicator settings allows traders to adjust its parameters to match different trading styles, timeframes, and market conditions. While the 12, 26, 9 configuration is the default and most widely used setting, traders can modify the fast EMA, slow EMA, and Signal Line periods to make the indicator more responsive or more stable. Shorter settings generate signals more quickly but may increase market noise, whereas longer settings produce fewer signals while helping filter out short-term price fluctuations.
Advantages And Limitations Of MACD
Like any technical analysis indicator, the MACD has both strengths and weaknesses:
| MACD Pros | MACD Cons |
| Identifies trend direction and momentum in one indicator | Generates lagging signals because it is based on moving averages |
| Easy to interpret and widely used | Can produce false signals in sideways markets |
| Highlights potential trend reversals through divergence | May react slowly to sudden price movements |
| Works across multiple markets and timeframes | Should not be used as a standalone trading indicator |
MACD vs. Moving Averages
Both MACD and MA are trend-following technical indicators, but they serve different purposes. A moving average smooths price data to help identify the overall trend, while the MACD measures the relationship between two exponential moving averages to evaluate both trend direction and momentum.
Compared with a single moving average, the MACD provides more detailed market insights by generating crossover, divergence, and momentum signals. However, moving averages are often preferred for identifying long-term trends, whereas the MACD is better suited for spotting changes in momentum and potential trend reversals.
MACD vs. RSI
The MACD and Relative Strength Index (RSI) are designed to evaluate momentum, but they focus on different aspects of market behavior. The MACD tracks the relationship between two moving averages to identify trend strength and momentum, while the RSI is an oscillator that measures whether an asset may be overbought or oversold.
Because they serve different purposes, the two indicators are often used together. The MACD helps confirm trend direction and momentum changes, whereas the RSI provides additional insight into potential reversal zones and market conditions.
The Bottom Line
The MACD is one of the most widely used technical indicators for evaluating trend direction and momentum. By understanding how it is calculated, how to interpret its signals, and how it compares with other indicators such as moving averages and the RSI, traders can use the MACD more effectively as part of a broader technical analysis strategy. While it can provide valuable insights into market conditions, it is most effective when combined with other indicators and price action rather than used in isolation.
This content is for informational purposes only and does not represent investment recommendations.
To Share
Published by
 Crypto.Andy